Monitoring and Recording the pH Value of Wastewater at Sake Brewery
Yokogawa’s industry-leading reliable Paperless Recorder series offers a multi-point touch panel to improve intuitive operator control with predictive monitoring for early detection during sake production and managing brewery wastewater.
Introduction
Sake brewing is an ancient tradition with seriously incredible fermentation science perfected over the centuries. Although there are many parallels between sake, beer, and wine, sake is made using a unique brewing process. Sake is not liquor as it is not distilled; it is brewed in a process that uses rice and lots of water. Water comprises as much as 80% of the final product, so ultra-pure water and fine rice are natural prerequisites if one hopes to brew great sake.
Contrary to what you may hear, brewery wastewater is not toxic or dangerous. It is high in carbohydrates and protein, primarily in the form of dissolved sugar and alcohol, and low in nutrients. These byproducts are part of what makes brewery wastewater unique.
The wastewater discharged during the manufacturing process of shochu must be adequately processed and released. So, it is necessary to confirm that the pH value of wastewater after treatment is within the reference value. Sake does not have a pH of 1.0. It is more like 4.1 to 4.7, about the same pH range as its distant brewed cousin beer, and less acidic than white wine (pH 3.0 to 4.1). As part of the Clean Water Act, the EPA sets pH discharge limits as part of the National Pollutant Discharge Elimination System (NPDES) permit to between 5.0 and 11.0.
Challenges
Accurately collecting data and anticipating process fluctuations is a real challenge in this industry. A basic collection method is simply grabbing a sample of your wastewater and testing the pH with a pH strip. Record the results in a log sheet (date, time, sample location, sample method, test result, comments, initials), and before too long, you have a record of your wastewater pH – you could even graph it. But the reality is this isn’t a fun task and is often a low priority. However, you can automate it.

This customer decided to automate this using a conventional paper recorder and experienced the following issues:
- The amount of paper to be stored becomes enormous and unmanageable
- Running out of pen and paper supplies left gaps in the required record-keeping.
- When looking for historical data, it was necessary to find the paper record, spread the charts, and search for the target data. It took significant time to find the corresponding data.
Solution

Since Yokogawa’s GX10 recorder is paperless, the painful maintenance of replacing chart paper and changing ink cartridges is over. No longer are critical records required for regulators missing; a sustainable improvement.
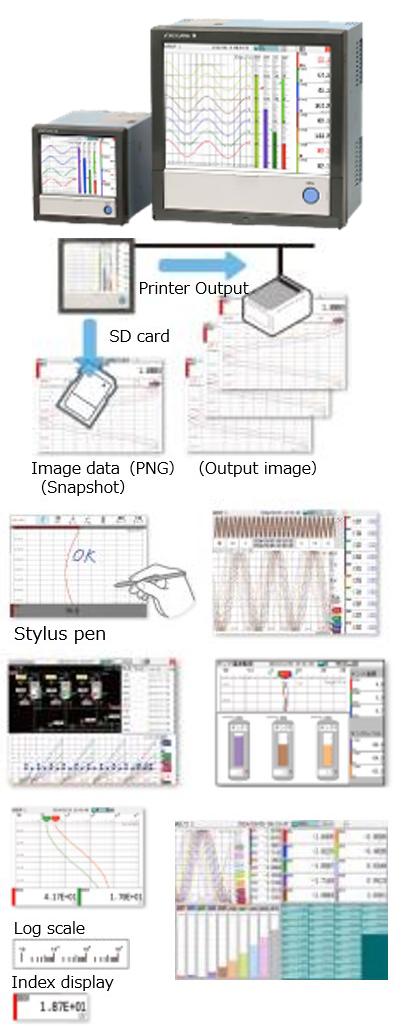
Users can scroll, pan, zoom historical data, and even write freehand messages on its dust-proof and water-proof display. The GX 10 is very convenient because the screen is straightforward and intuitive in its operation.
You can change the waveform display vertically or horizontally, so you can quickly check the data on the screen. You can operate it with the touch screen even when viewing past data. After reviewing the data, you can sign and date the record on the screen (using a stylus pen), just like a paper chart.
Key Benefits
- Easy access to historical data
- By flicking or dragging the trend display, you can scroll and display the past trend seamlessly
- Saving and outputting image files
- You can save trends and graphics as images (PNG) when an alarm occurs. At the same time, it can output to the printer
- Write to the display with a stylus pen
- You can notate the chart by hand using a stylus pen where you find the events you are interested in
- Grasp the long-term trend at a glance
- You can see the long-term trend at a glance by shrinking and displaying it on one graphic in its entirety
- Custom display
- You can lay out parts such as digital, trend, bar graph, and images freely and can monitor with custom graphics adapted to your site
- Multi-split graphic
- You can select from 9 different split graphic configurations and register up to 20 split graphic screens (Multiple split graphic screens on a single display are only available on the GX20 / GP20)
- Display and record physical quantities using the Log scale (logarithmic scale)


